Next: Stopping criteria Up: Tomography Previous: Resolution Contents
Error sensitivity
To test the error sensitivity of the inverse tomographic problem we
take the test model from section 3.1 and impose
errors in the projection/forward model/imaging process. Here the
sensitivity to two sources of errors will be discussed. The first
is in the sensitivity of the cameras and the second is in uncertainties
concerning the directions of the lines-of-sight. The
sensitivity errors are introduced by multiplying the modelled images
from the stations at 50 km north and 100 km south by 1.03 and the
model image from the station at 50 km south by 0.97, modelling an
uncertainty of 3 % in camera sensitivity. To test the
sensitivity to errors in orientation, the 1-D images are randomly
shifted by one pixel for all stations simulating an angular uncertainty of
![]() . The uncertainties are first applied separately and
finally together. The
imperfect 1-D images are then used to make reconstructions with both
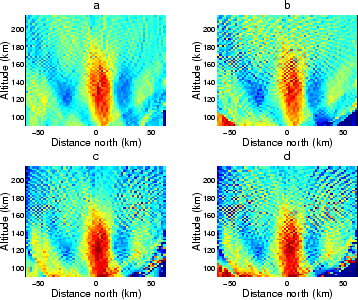
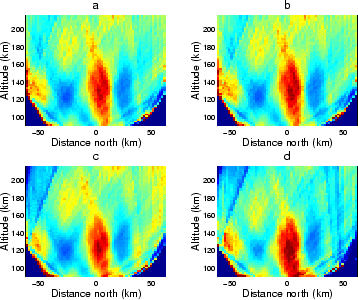
damped least square and the ART inversion. The result is that even for the perfect images the reconstructions are more coarse
than the auroral model, as can be seen in the upper-left panels of
Figure 3.8 and Figure 3.9. For the
non-perfect projections, the noise in the images makes the damped
least square reconstructions, in particular, more noisy but also the
ART reconstructions show artifacts manifested mainly as streaks in the
radial direction from the stations.
. The uncertainties are first applied separately and
finally together. The
imperfect 1-D images are then used to make reconstructions with both
damped least square and the ART inversion. The result is that even for the perfect images the reconstructions are more coarse
than the auroral model, as can be seen in the upper-left panels of
Figure 3.8 and Figure 3.9. For the
non-perfect projections, the noise in the images makes the damped
least square reconstructions, in particular, more noisy but also the
ART reconstructions show artifacts manifested mainly as streaks in the
radial direction from the stations.
 |
 |
Next: Stopping criteria Up: Tomography Previous: Resolution Contents
copyright Björn Gustavsson 2000-10-24