ALIS is used to detect the appearance of PSCs and also to obtain temporal variation in the 3D distribution of the cloud surfaces. In 1997 ALIS made PSC observations, presenting a temporal development of the two-dimensional altitude distribution during three events, 9, 11 and 16 January 1997 [Steen et al., 1997b]. Measurement techniques and the derivation of a composite colour image (derived from three images obtained with narrow-band interference filters for the three main auroral lines 6300 Å, 5577 Å and 4278 Å) are presented in Steen et al. [1999b] and Enell et al. [1999c]. According to Steen et al. [1999b] ``it would, at least in principle be possible to invert the particle size distribution in the PSC by measuring the absolute colour variation, 3-D surface location, wind parameters and temperature, using an optical transport model''. Enell et al. [1999b] states that, in certain cases, it might be possible to retrieve the particle size distribution in a section across the PSC from narrow-band images in several wavelengths. An example of time development of an altitude contour of PSC cloud-bases calculated by triangulation was also presented in this paper.
A feasibility study regarding the use of multi-station imaging systems for studies of PSC physics was presented by Enell et al. [2000], proposing a method to solve for particle sizes using bistatic multi-wavelength observations. As it has not yet been possible to apply this method to real measurements, numerical simulations for an ideal case (single scattering, spherical particles) work with reasonable results, even if random noise is added. Despite these positive results, a major complication is that light is scattered not only from the cloud particles, but also from the entire atmospheric column observed. A background correction, assuming a smoothly varying atmospheric background must therefore be applied. An example of a background correction by quad-tree decomposition is discussed by Enell et al. [1999a]. Should this method prove to be practically applicable, an important issue might be to determine the probability that actual PSC incidence gives rise to visually observable mother-of-pearl clouds, for example for interpretation of historical reports of PSC sightings. Such studies would be of interest for modellers of atmospheric chemistry and radiative transfer.
Enell et al. [2003] presented a case study of the development of visible PSCs observed by ALIS. The paper concerns automatic and manual altitude determination of PSC observations made on 9 January 1997 from two ALIS stations (Figure 6.16).
![\begin{psfrags}
%
\psfrag{Image 1}{1~Kiruna} \psfrag{Image 2}{3~Silkkimuotka} \...
...135\textheight]{eps/science/psc/FIGtrsurf141930.eps}
\\ [-10pt]
\end{psfrags}](img555.png)
![\includegraphics[keepaspectratio=false,width=0.52\textwidth,height=0.135\textheight]{eps/science/psc/FIGtrimgs142500.eps}](img556.png)
![\includegraphics[keepaspectratio=false,width=0.375\textwidth,height=0.135\textheight]{eps/science/psc/FIGtrproj142500.eps}](img557.png)
![\includegraphics[keepaspectratio=false,width=0.52\textwidth,height=0.135\textheight]{eps/science/psc/FIGtrimgs144700.eps}](img558.png)
![\includegraphics[keepaspectratio=false,width=0.375\textwidth,height=0.135\textheight]{eps/science/psc/FIGtrproj144700.eps}](img559.png)
![\includegraphics[keepaspectratio=false,width=0.52\textwidth,height=0.135\textheight]{eps/science/psc/FIGtrimgs145610.eps}](img560.png)
![\includegraphics[keepaspectratio=false,width=0.375\textwidth,height=0.135\textheight]{eps/science/psc/FIGtrproj145610.eps}](img561.png)
![\includegraphics[keepaspectratio=false,width=0.52\textwidth,height=0.135\textheight]{eps/science/psc/FIGtrimgs150940.eps}](img562.png)
![\includegraphics[keepaspectratio=false,width=0.375\textwidth,height=0.135\textheight]{eps/science/psc/FIGtrproj150940.eps}](img563.png)
![\includegraphics[keepaspectratio=false,width=0.52\textwidth,height=0.135\textheight]{eps/science/psc/FIGtrimgs152130.eps}](img564.png)
![\includegraphics[keepaspectratio=false,width=0.375\textwidth,height=0.135\textheight]{eps/science/psc/FIGtrproj152130.eps}](img565.png)
![\includegraphics[keepaspectratio=false,width=0.52\textwidth,height=0.135\textheight]{eps/science/psc/FIGtrimgs152910.eps}](img566.png)
![\includegraphics[keepaspectratio=false,width=0.375\textwidth,height=0.135\textheight]{eps/science/psc/FIGtrproj152910.eps}](img567.png)
|
Early on it was realised that ALIS might be usable for spectroscopic studies of certain astronomical objects, such as comets and meteoroids ejected from comets. Images were acquired of both the Hyakutake and Hale-Bopp comets, however none of these data-sets have yet been analysed.Vi missade på Mars, kom ur dess bana
och för att undgå fältet Jupiter
vi lade oss på kurvan ICE-tolv
i Magdalenafältets yttre ring,
men mötte stora mängder leonider
och väjde vidare mot Yko-nio.
Vid fältet Sari-sexton uppgav vi försöken
att vända om.
Meteor showers are one of few processes taking place above the troposphere that are observable by the naked eye. This influx of extraterrestrial matter to Earth, on the order of 100 tons per day [Love and Brownlee, 1993] gives rise to the permanent layer of metal atoms in the 80-110 km altitude region [Höffner and von Zahn, 1999]. The study of these phenomena has important implications with respect to irregularities in long range radio communications, sporadic E-layers, as well as the survivability of artificial satellites, etc.
Modelling studies [McNeil et al., 1995; McNeil et al., 2001] combined with LIDAR observations [Höffner and von Zahn, 1999; von Zahn et al., 1999] as well as observations by the GLO-1 instrument on the space-shuttle [Gardner et al., 1999] have yielded significant new information on the mechanisms involved in the formation of meteor-trails and their properties.
When cosmic dust particles enters the Earth's atmosphere, heating and ablation of the material causes deposition of metals at altitudes between 80 and 110 km. As the atmospheric density increases exponentially along the particle trajectory, the ablation increases with decreasing altitude. On the other hand, due to atmospheric friction, the particle eventually reaches its terminal velocity, corresponding to a temperature lower than that needed for ablation to take place. Particle mass and particle velocity determine the altitude at which ablation takes place. Given high enough velocity (about 30 km/s) a particle ablates completely, otherwise parts of the material fall to ground unablated [McNeil et al., 1998]. In essence this means that different elements are released from the meteor at different times, as demonstrated by von Zahn et al. [1999] using ground-based LIDARs.
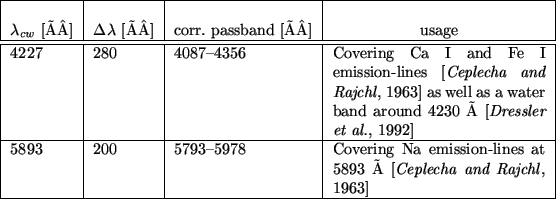
ALIS could be used to study such differential ablation phenomena in meteor trails. The easiest meteoroid constituents to observe are the quite common sodium (Na) and calcium (Ca). These elements have strong emission lines at 5893 Å and 4227 Å [Ceplecha and Rajchl, 1963]. The evaporation is a temperature-dependent process for the different constituents. According to the differential ablation model there is a distinct altitude difference of several kilometres for the sodium and calcium deposition distributions. This should be quite easily seen with two or more ALIS stations equipped with the proper filters, especially for slow meteors. However, there are other practical problems concerning observations of this type. A meteor is most often seen during a short interval of just one second or less, and this must occur while the shutter is open. To maximise the possibility of acquiring an image of a meteor-trail, the stations should be operated with overlapping exposures, so that there are always at least two imagers with open shutters. In this way simultaneous imaging from up to six stations might occur, so that the altitude distribution of the meteor trails could be triangulated, while some stations simultaneously image the trails in the rather strong sodium (5893 Å) and calcium (4227 Å) emission lines [Ceplecha and Rajchl, 1963].
In a simulated study [Brändström et al., 2001] it was suggested that
ALIS would operate with all six stations. The imagers would be
oriented to observe a common volume, in order to enable triangulation
of altitudes. The CCD-detectors are operated in maximum resolution
mode (
![]() pixels) and with the longest possible
integration times without saturating the CCD (on the order of several
minutes). The dynamics is recorded by quickly opening and closing the
shutter, with a period of 50 ms. (In principle this should be
possible, but there are still some technical problems to be solved.
Another option is to install a separate ``meteor-shutter''.)
Performing the observations in this way increases the probability of
observing a meteor and gives the possibility to study the velocities
of a particular meteor at different altitudes.
pixels) and with the longest possible
integration times without saturating the CCD (on the order of several
minutes). The dynamics is recorded by quickly opening and closing the
shutter, with a period of 50 ms. (In principle this should be
possible, but there are still some technical problems to be solved.
Another option is to install a separate ``meteor-shutter''.)
Performing the observations in this way increases the probability of
observing a meteor and gives the possibility to study the velocities
of a particular meteor at different altitudes.
In order to attempt experiments involving meteor observations, two filters
with suitable passbands were procured (Table 6.5).
 |
Some preliminary studies were carried out during the Leonid showers of 1996 (without the meteor filters), 1999, 2000 and 2001. These observations yielded no usable results mainly due to bad weather conditions, although, important knowledge about how to perform an observation of this type was gained. The main objective with these experimental observations was to try to observe a predicted differential ablation process.
Successful observations of a meteor trail using two adjacent ALIS stations (Kiruna, and the mobile station) were obtained on 19 November 2002, at 03:48 UTC. The observed Leonid probably originated from the population ejected from the comet 55P/Tempel-Tuttle in 1767 according to the dust-trail simulations and observations by McNaught and Asher [1999]. Consequently this meteoroid was on its 7th period around the sun and still quite young in the sense that it had not lost much of its volatile constituents. Four images of this meteor trail appear in Figure 6.17.
|
In Figure 6.18 projected altitude profiles for the images in Figure 6.17 appear.
![\includegraphics[width=\textwidth]{eps/science/meteor/meteoroid11.eps}](img574.png)
|
![\includegraphics[width=\textwidth]{eps/science/meteor/meteoroid12.eps}](img575.png)
|
Similar optical observations of high-altitude Leonids have been
reported from 1998 Leonids by Spurny et al. [2000] and there is still
no good explanation for them. While their observations were made in
white light, the rather wide passband of the filter used for the
ALIS-observations might provide a hint as to a possible origin of
these unusual high and bright Leonids. The 280 Å bandwidth of the
4227 Å filter corresponds to a corrected passband of about 4077 Å to
4356 Å (Equation 3.45). Dressler et al. [1992] report luminescence
measurements of
![]() supra-thermal charge transfer
collisions and have measured hydrogen atom Balmer series and
supra-thermal charge transfer
collisions and have measured hydrogen atom Balmer series and
![]() emissions at high energies overlapping the passband of the
ALIS observations. This observation can thus restrict the origin of
these high-altitude meteors to one possible explanation. The water is
still bound to some minerals in these young meteors. By reaching
temperatures of above 1500 K which occurs already at about 130 km
altitude in the meteor impact process, the water is suddenly released
in a fast and bright process.
emissions at high energies overlapping the passband of the
ALIS observations. This observation can thus restrict the origin of
these high-altitude meteors to one possible explanation. The water is
still bound to some minerals in these young meteors. By reaching
temperatures of above 1500 K which occurs already at about 130 km
altitude in the meteor impact process, the water is suddenly released
in a fast and bright process.
This explanation was found in March 2003. Therefore the value of observing water from meteoroides, cannot yet be evaluated, especially in the perspective of the present observing instrument ALIS. The analysis of this case continues and a manuscript is in preparation [Pellinen-Wannberg et al., 2004].
![\includegraphics[width=0.2\linewidth]{eps/science/meteor/S01_034820-0sw.eps}](img570.png)
![\includegraphics[width=0.2\linewidth]{eps/science/meteor/S10_034810-0sw.eps}](img571.png)
![\includegraphics[width=0.2\linewidth]{eps/science/meteor/S10_034840-0sw.eps}](img572.png)
![\includegraphics[width=0.2\linewidth]{eps/science/meteor/S10_034910-0sw.eps}](img573.png)