This information is originally from Lancaster University, Department of Physics.
The quiet-day curves are an indication of the noise-level Riometer would be expected to measure on a day without any absorption, scintillation or interference. Quiet-day curves can be generated by theoretical or empirical means. The method we use is empirical and is explained below:
- For a given period (usually 14 days) arrange the data (per beam)
into 10m intervals, based upon the
sidereal time.
- Take the median of the 600 samples.
- For each interval sort the data.
- Discard the largest value as it may be corrupted by interference (e.g. lightning, solar radio emissions or scintillation).
- Take the mean of the next two largest values.
- Repeat for each beam and each 10m interval in the
sidereal day.
The basis of the algorithm is to find the largest value received
(excluding interference) for any time in the sidereal day.
An alternative method sometimes is employed is based on the above, but
with a sliding median of 1s resolution data. Thus 86164 blocks, per
beam, per sidereal day, are considered.
ADC- Analogue to digital
converter.
Absorption- The process by which energy in a radio wave passing
through the ionosphere is converted to heat through electron
collisions with other particles. For applications using frequencies
above the VLF range, absorption predominately occurs
in the D region. The amount of absorbed energy
is normally expressed as a ratio of the expected level to the measured
level, and is given in decibels (dB).
Aurora- A faint visual phenomenon associated with geomagnetic activity,
occurring mainly in the high-latitude night sky. Typical auroras
occur 100 to 250 km above the ground as high speed particles from
the solar wind collide with atmospheric gasses at these
altitudes. When observed in the northern hemisphere this phenomena is
known as the Aurora Borealis (northern lights), and when viewed in
the southern hemisphere it is the Aurora Australis.
Auroral Oval- An oval band situated between magnetic latitudes of 64 and 70°
where the visible aurora occurs overhead. During
disturbed geomagnetic conditions, the auroral oval generally expands
equatorward. Areas within the auroral ovals are called the
polar cap.
Beam Forming Network- Each port of the BFN corresponds to one lobe of the given
MBA. Impressing a signal to one of the n
ports produces a beam pointing in a direction unique to that port.
MBA systems use both variable and fixed power dividing or combining
BFNs. With the latter, the radiation pattern shape is determined
during manufacture of the antenna; a variable BFN permits the
radiation pattern shape to meet changing operational requirements for
which the antenna is designed. IRIS uses a Butler Matrix (Butler Beam
Forming Matrix, BBFM) to form 49 pencil
shaped lobes.
BFN- Beam Forming
Network.
Butler matrix- Beam forming network that produces
multiple narrow lobes from an array of
antennas.
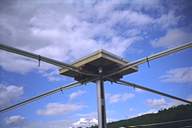
Crossed-dipole- An antenna consisting of 2 half-wavelength dipoles, intersecting at
90°.
D Region- A daytime layer of the Earth's ionosphere approximately 50 to
90 km in altitude. The D layer is effective as a reflector only
for frequencies below VLF. It is the primary
cause of absorption for signals in the HF band.
Directivity for Antenna Arrays- The calculation of the antenna directivity, or voltage reception
pattern, for an array of antenna elements is a straightforward
superposition of the field amplitudes in the radiation zone. If
identical antennas are used, with uniform spacing and orientation over
the array, the calculation of the array factors is independent of the
antenna type, and the total directivity becomes the product of the
directivity of a single antenna, with the factors representing the
contributions from the geometrical superposition of the antenna
signals.
Distributed Array- A distributed array is an array of antenna elements where each
element is connected to its own receiver/transmitter unit.
E Region- A daytime layer of the Earth's
ionosphere roughly between the altitudes of 85 and 140 km.
F Region- The upper layer of the ionosphere,
approximately 120 to 1500 km in altitude.
Field of View- When talking about Multiple Beam
Antennas: The n beams produced by exciting each port of the
BFN individually span the field of view.
High Frequency (HF)- The portion of the radio frequency spectrum between 3 and
30 MHz. This frequency range, characterized by wavelengths
between 10 and 100 meters, is commonly called the Short Wave
band.
Imaging or narrow beams- Beams generated from the 8 × 8 array of
crossed dipoles.
Imaging Riometer- A single riometer station which measures
the absorption not only in zenith, but in some angular interval. This
is done by using an antenna with many narrow lobes. All the measurements together can be displayed in an
image showing the current absorption not
only in one point of the celestial sphere but in a whole region, for
example inside a region of 200 × 200 km.
Ionosphere- The region of the Earth's upper atmosphere containing a small
percentage of free electrons and ions produced by photoionization of
the constituents of the atmosphere by solar ultraviolet radiation at
very short wavelengths (<100 nm). The ionosphere significantly
influences radiowave propagation of frequencies less than about
30 MHz.
IRIS- Imaging Riometer for
Ionospheric Studies.
Isotropic radiator- An antenna which behaves identically in all directions.
MBA- Multiple
Beam Antenna
Multiple Beam Antenna- Multiple antennas whose outputs are combined by a
beam-forming network (BFN).
NaN- The IEEE Standard 754 defines a class of numbers known as NaN, or Not
a Number. This value is used by the IRIS processing software to indicate missing data.
Obliquity factor- The increase in path length through the ionosphere that an oblique
ray takes relative to a vertical ray.
Planar Array Antenna- N antennas distributed evenly to form an array with N
elements. The antennas are combined by a Beam Forming Network to produce N beams which span the
field of view (FOV). All elements of the
array are identical, and each element covers the entire FOV. Hence the
N beams span that space approximately defined by the half-power
beamwidth of the radiation pattern of an element in the array. With a
phased array, it is possible to produce multiple, truly simultaneous
beams.
Polar Cap- The area of the ionosphere located
within the auroral oval, either north or
south. Plasma is convected across the polar cap from dayside to
nightside by electric fields in the magnetosphere.
Polar Cap Absorption (PCA)- An anomalous condition of the polar ionosphere whereby
HF and
VHF radiowaves are
absorbed, and LF and VLF radiowaves are
reflected at lower altitudes than normal. In practice, the
absorption is inferred from the proton
flux at energies greater than 10 MeV, so that PCAs and proton
events are simultaneous. Transpolar radio paths may still be disturbed
for days, up to weeks, following the end of a proton event.
Quiet-day curve (QDC)- The quiet-day curve shows the background cosmic noise level on a day
without absorption, solar radio emissions etc. (i.e., a quiet day). The
QDC varies with sidereal time as the background cosmic noise is not
constant in all directions.
An empirical method is
used to generate the QDCs.
RADAR- A Radio Detection
And Ranging system used to detect
the presence and location of objects by the transmission and return of
an electromagnetic signal.
Riometer- Relative ionospheric
opacity meter. Measures the
intensity of cosmic radio noise at the surface of the Earth. Usually
operates at about 20 to 50 MHz. IRIS operates at
38.2 MHz. Radiation of that wavelength is absorbed in the
Earth's
D region of the
ionosphere. The frequency of
38.2 MHz is reserved for research.
S4 index- A method of quantifying the amount of scintillation present.
Scintillation- Signal variation due to naturally-ocurring (or sometimes man-made)
irregularities in the ionopshere. The effect is the same as the
visible twinkling of stars due to variations in the
atmosphere. Scintillation is
readily identified in the data. Scintillation is most easily
explained by analogy to a diffraction grating. Ionospheric
irregularities are the equivalent of the diffraction grating. The
received signal is then the sum of signal from multiple paths. As the
path lengths change the signal varies due to constructive and
destructive interference, hence the star twinkles. In other words,
scintillation is variations in amplitude, phase, polarization and
angle of arrival of a radio wave upon passing through the ionosphere,
such as would occur with a satellite signal. Scintillations can be
severe (especially near the equator) and present problems to
communication services.
Sensitivity- When
talking about riometer experiments,
sensitivity refers to the minimum change in sky temperature (measured
in Kelvin (K)) that can be detected by the given riometer system. It
is also important how big the area is that is affected by the
temperature change. Generally, the requirements the antenna system
has to fulfil in order to achieve the required spatial resolution are
harder to fulfil than the requirements for a reasonable
sensitivity. This means that, in general, one need not worry about the
sensitivity being too low.
Sidereal time- Time measured with respect to the stars as opposed to the sun. 1 mean
sidereal day = 23h 56m 4.09053s of mean solar time. (The
Astronomical Almanac 1996 p. B6)
Universal Time (UT)- Universal time is approximately the same as Greenwich Mean Time (GMT). Like
GMT UT does not include daylight saving changes. The US Naval
Observatory has more information about
universal time.
Very High Frequency (VHF)- The portion of the radio frequency spectrum from 30 to 300 MHz.
Very Low Frequency (VLF)- The portion of the radio frequency spectrum from 3 to 30 kHz.
Widebeam- The widebeam antenna is a single crossed-dipole (or other broad beam) antenna. It is not part of the
imaging antenna array so it provides no
information about the location of any absorption. It is useful for
providing an overview of any ionospheric activity.