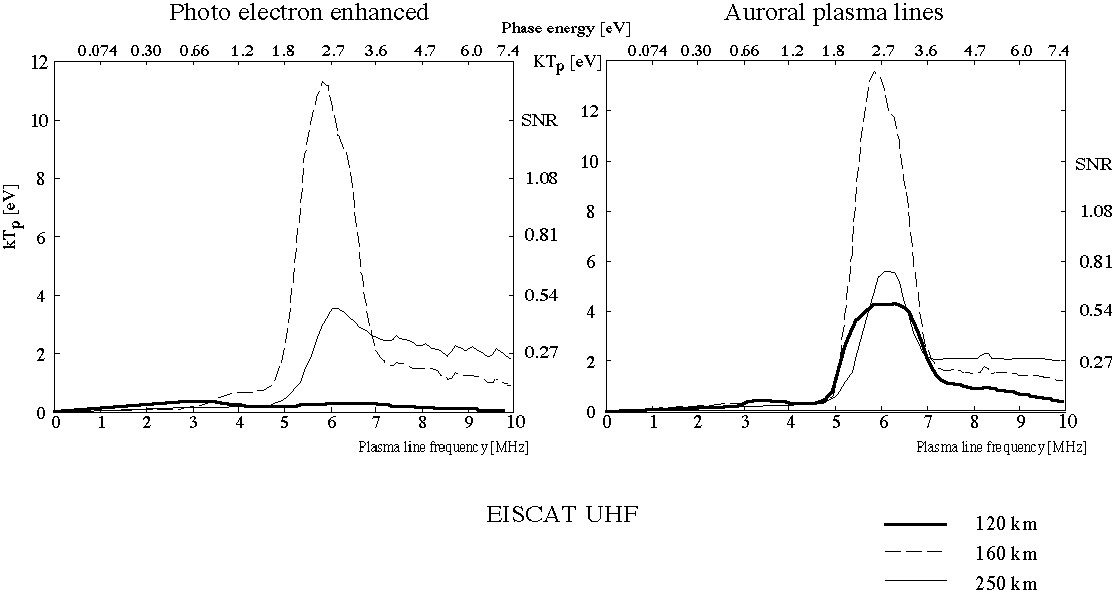
 Predicted plasma line strength for the EISCAT Svalbard radar for daytime and auroral conditions and three different altitudes. The left y-axis gives the plasma line temperature in eV, the right y-axis the F-region (250 km) signal to noise ratio for typical conditions. The upper x-axis gives the phase energy for the resonant electrons. The lower x-axis gives the palsma line frequency.