 (1)
(1)
T. Wagner1, C.F. Enell2
1Institut für Umweltphysik, University of Heidelberg, Germany
2Institutet för Rymdfysik, Kiruna, Sweden
Introduction
UV-vis absorption spectroscopy using extraterrestrial light sources
is a widely used technique for the measurement of atmospheric trace gases,
in particular for remote sensing of stratospheric species. BrO and OClO
show characteristic absorption features in the UV-vis spectral range which
can be detected in spectra of zenith scattered light measured at the ground.
The DOAS technique allows to identify and quantify the absorption of these
species. In sections 1 to 6 a general description of the DOAS method and
its application to ground based measurements of zenith scattered light
is given. The specific details of the BrO and OClO analysis are presented
in sections 7 and 8.
1 The Beer-Lambert Law
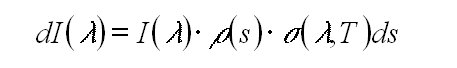
The absorption of radiation by matter is described by the Beer-Lambert
law. The absorption of light of the intensity I(l
) at the wavelength l as it passes through
an infinitesimally thin layer of an absorbing matter ds is:
(1)
Here s(l ,T)
is the absorption cross section of the absorbing species which depends
on the wavelength and temperature and r(s)
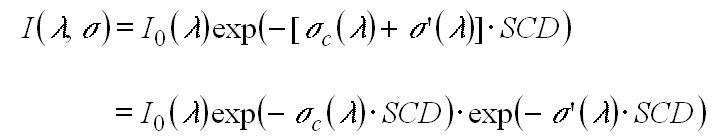
is its concentration. Integration of equation 1 for a finite light path
through the absorbing species leads to the relationship between the incident
light intensity I0(l ) and
the transmitted light intensity I(l ),
known as the Beer-Lambert law:
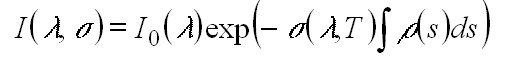 (2)
(2)
The logarithm of the ratio of the measured I and I0 is called optical density t(l ).
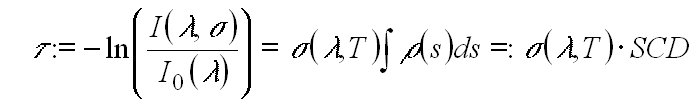 (3)
(3)
From t(l )
the (slant) column density SCD := of
the absorbing species can be calculated; if the concentration is constant
along the absorption path the concentration can be derived.
of
the absorbing species can be calculated; if the concentration is constant
along the absorption path the concentration can be derived.
2 Differential optical absorption spectroscopy (DOAS)
The Beer-Lambert law can not directly be applied to atmospheric measurements because of several reasons:
a) Besides the absorption of the trace gases light extinction occurs also due to scattering on molecules and aerosols. Especially for aerosols this extinction can not be corrected for with the desired accuracy.
b) In the atmosphere the absorptions of several species always add up to the total absorption. Thus in most of the cases it is not possible to measure one specific species.
c) In the case of satellite measurements the detected intensity can strongly depend on the ground albedo.
These restrictions can be avoided by applying the method of differential optical absorption spectroscopy (DOAS).
The DOAS technique relies on the measurement of absorption spectra instead of the intensity of monochromatic light (Equation 2). Thus it is possible to separate the absorption structures of several atmospheric species from each other as well as from the extinction due to scattering on molecules and aerosols. The DOAS method was introduced by Perner and Platt [1979], and a detailed description can be found in Platt [1994].
The key principle of DOAS is the separation of the absorption in a part which represents broad spectral features and in a part representing narrow spectral features. Consequently s(l ) of a certain absorbing species is split into a portion sc(l ) which varies only 'slowly' with the wavelength land into a portion s ' (l ) which shows 'rapid' variation with l:
s(l ) = sc(l ) + s '(l ). (4)
The definition of the threshold between 'slow' and 'rapid' variation
of the absorption cross-section as a function of wavelength depends on
the observed wavelength interval and the width of the absorption bands
to be detected. Commonly the spectra are filtered by dividing by a fitted
polynomial or by a smoothed spectrum. Conventionally s
' (l ) is called differential absorption
cross-section (see Figure 1).
 (5)
(5)
Accordingly the differential optical density t
' (l ,s
,s')
can
be determined, which is defined as
t ' (l
,s
,s') := ln [I(l
,s -s')/I(l
,s )]. (6)
In practice I(l ,s -s ') is determined applying the similar high pass filter to the measured spectrum.
Combining Equation 3 and Equation. 6, it follows immediately that
t ' (l
,s
,s') = t(l
,s ) - t (l
,s -s').
(7)
This is demonstrated also on Figure 1. The slant column density of a
desired trace species can now be calculated
SCD' := t' (l
,s ,s') /
s'.
(8)
The new expression SCD' (compared to SCD derived from Equation. 3) indicates that it is calculated from 'differential' quantities.
In the practical DOAS evaluation process the laboratory spectra of different absorbing trace gases are least squares fitted to the atmospheric spectrum. >From the result of the fitting procedure the slant column density can be determined. Because several absorbing trace gases
can be simultaneously detected by their specific spectral absorption features the DOAS method is widely used for atmospheric measurements.
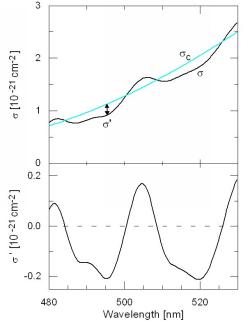
Figure 1 Splitting of the absorption cross section into a 'slowly'
and 'rapidly' varying part [adapted from Otten, pers. communication].
3 The spectral fitting process
The measured spectrum is fitted by the absorption spectra of the trace gases absorbing in the respective spectral range and a polynomial of a specified degree by means of a non linear least squares fitting algorithm [Gomer et al., 1993; Stutz and Platt, 1996]. This fitting algorithm uses the Levenberg-Marquard method [Levenberg, 1944; Marquardt, 1963] which is an iterative combination of a linear part for the retrieval of the trace gas absorptions and a non linear part which accounts for possible spectral shifts between the measured spectrum and the reference spectrum.
Since the spectra are recorded with a diode array of 1024 discrete elements
the obtained signal by a single diode represents the integrated intensity
over the wavelength range which is covered by this diode:
I(li) =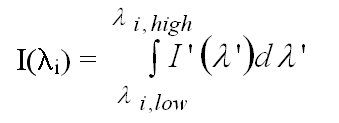 (9)
(9)
Here li denotes the centre wavelength of the diode element, li,low the shortest wavelength and li,high the longest wavelength covered by the element.
The aim of the linear fitting process is to minimise the sum over the
measured optical depths t '(li)
of the individual diode elements of the selected wavelength range:
½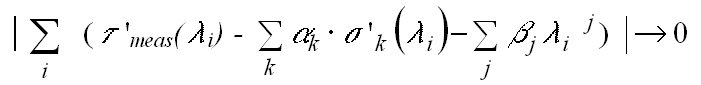 (t
'meas(li)
-
(10)
(t
'meas(li)
-
(10)
Here sk'(li)
denotes the differential cross section of the k-th trace gas taken into
account by the fitting routine. The derived fit coefficient ak
is the desired SCD of this species.  is
a polynomial often used to account for broad band features, e.g. from Rayleigh-
and Mie-scattering. In the second part of the fitting process the wavelength
calibration of reference spectra is varied with respect to the measured
spectrum to achieve the best match of the absorption features in the measured
spectrum. For that purpose the reference spectra are interpolated and the
grid points li are replaced by the
values of the new wavelength lf(i).
For the OClO and BrO evaluations described below linear shifts and also
squeezes of the reference spectra were allowed according to f(i) = a +
b × i.
is
a polynomial often used to account for broad band features, e.g. from Rayleigh-
and Mie-scattering. In the second part of the fitting process the wavelength
calibration of reference spectra is varied with respect to the measured
spectrum to achieve the best match of the absorption features in the measured
spectrum. For that purpose the reference spectra are interpolated and the
grid points li are replaced by the
values of the new wavelength lf(i).
For the OClO and BrO evaluations described below linear shifts and also
squeezes of the reference spectra were allowed according to f(i) = a +
b × i.
For measurements of scattered solar radiation two further spectra are included in the fitting process: one spectrum to correct the Ring-effect (see below) and another to account for the solar Fraunhofer lines which are the most dominant features in the recorded spectra. To remove this structures it is a commonly used method to divide the measured spectra (usually taken at large SZA and thus large atmospheric absorptions) by a spectrum measured at small SZA (and thus small atmospheric absorptions). This spectrum is usually referred to as Fraunhofer reference spectrum. The result of the fitting process then yields the difference of the atmospheric absorptions; thus the absorption of the Fraunhofer spectrum has to be added to derive the total absorption of the measurement. In practice, usually the logarithm of the Fraunhofer spectrum is simultaneously included in the fitting process.
The spectral resolution of DOAS instruments in the UV/vis region is
usually in the range of about a few tenths to several nanometers. Thus
the natural line widths of the atmospheric absorptions are not resolved.
To account for this the absorption cross sections of the trace gases have
to be convoluted by the instrumental slit function f(l
) before they are used as input for the fitting routine (equation 10).
 (11)
(11)
4 The 'solar I0-effect'
Because of the large number of Fraunhofer lines the intensity of the
solar spectrum varies strongly with wavelength. In particular for absorptions
showing also narrow spectral structures the absorptions found in measured
atmospheric spectra can not be fitted properly by the respective cross
sections (which are usually measured in the laboratory using a light source
with a smooth spectrum, e.g. a black body radiator). Because these errors
arise from the spectral structures of the I0 spectrum it is
usually referred to as solar I0 effect [Paul Johnston, pers.
comm.; Platt et al., 1997, Friess, 1997; Richter, 1997; Van Roozendael
et al., 1999b; Wagner, 1999]. While for most of the atmospheric absorbers
this leads only to negligible effects in some cases the I0 effect
has to be considered. This is in particular the case when strong atmospheric
absorbers like O3 have to be 'removed' to measure the underlying
weak absorptions of other trace gases like BrO. The solar I0
effect can be accounted for using so called 'I0 corrected' cross
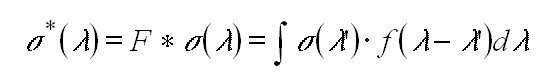
sections. These can be calculated in the following manner: First the highly
resolved solar spectrum I0(l ) is
convoluted with the instrument slit function:
 (12)
(12)
In the next step the absorption spectrum of the chosen trace gas (calculated
with a highly resolved cross section and solar spectrum) is convoluted
with the instrument slit function:
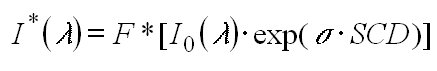 (13)
(13)
The I0 corrected cross section is then derived:
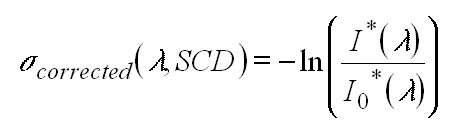 (14)
(14)
Clearly I0-corrected cross sections derived in this manner
can perfectly match the absorptions in the measured atmospheric spectrum
only if the same SCD was used for the calculation which appeared in the
atmosphere. However, it turned out that this was not a critical point and
the I0 corrected cross sections could be used for a large range
of atmospheric SCDs.
5 Correction of the Ring effect
In addition to Rayleigh- and Mie-scattering which are elastic scattering
processes in the Earth's atmosphere the solar radiation is also scattered
by Raman-scattering whereby the photon's energy changes (see Figure 2).
Rotational Raman scattering is thought to be the (most probable) cause
for the so called 'Filling in' of the Fraunhofer lines [Bussemer, 1993;
Vountas et al., 1998] (and to a lesser degree also of the atmospheric
absorption
lines [Fish and Jones, 1995]); it was first discovered by Grainger and
Ring [1962] and referred to as Ring-effect. Although the Ring effect is
only of the order of a few per cent it significantly affects DOAS measurements
of scattered radiation: The Fraunhofer lines of the measured spectra can
thus not perfectly corrected for by the inclusion of the Fraunhofer spectrum
in the fitting process. In consequence structures (up to several per cent
in the UV spectral range) remain which mask the weak atmospheric absorptions
if the Ring effect is not properly corrected for.
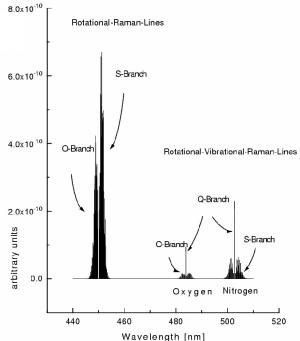
Figure 2 Transitions for rotational and vibrational Raman scattering
on O2 and N2 molecules (adapted from Haug [1996]).
Usually the Ring effect is corrected for by including a further spectrum into the fitting process [Solomon et al., 1987].
The light Imeas detected by the instrument was either scattered
in the atmosphere by molecules or aerosols or reflected at the earth's
surface. While Rayleigh- and Mie-scattering as well as the reflection are
elastic processes, the Raman scattering on molecules introduces an inelastic
contribution to the measured light.
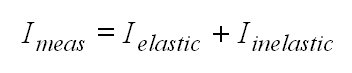 (15)
(15)
To analyse a measured spectrum the negative logarithm of Imeas is taken (DOAS fitting process, see section 3).
Since Iinelastic is very small (about a few per cent)
compared to Ielastic the logarithm can be approximated
by the first two terms of the Taylor expansion:
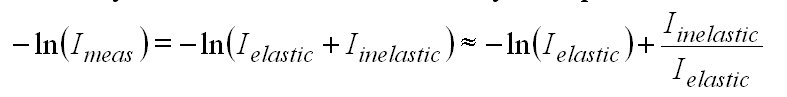 (16)
(16)
with
IRing :=
Iinelastic/Ielastic
(17)
IRing is usually referred to as Ring spectrum and it can be included in the fitting routine to correct the Ring effect.
From the known energies of the rotational states of the two main gases
of the atmosphere, O2 and N2, the cross section for
rotational Raman scattering can be calculated. This can be done by including
Raman scattering into radiative transfer models [Bussemer, 1993; Fish et
al., 1995] or by calculating the pure ratio of the cross sections for Raman
and Rayleigh scattering.
6 Modelling of the atmospheric radiative transport
For the analysis of DOAS measurements using direct or scattered solar
radiation traversing the atmosphere, the so-called air mass factor concept
has been developed (see e.g. Noxon et al. [1979], Solomon et al. [1987b]).
Since the measured slant column density (SCD), the integrated trace gas
concentration along the light path, strongly depends on the solar zenith
angle (SZA), it is advantageous to convert the SCD into a vertical column
density (VCD), the vertically integrated trace gas concentration. This
conversion is usually performed by dividing the SCD by the air-mass factor
(AMF):
VCD = SCD(SZA) / AMF(SZA) (18)
Here we use the 'traditional' AMF-approach: First the SCDs of the trace gases are derived from the spectral analysis of the measured spectra. Second these SCDs are converted to VCDs by dividing by the AMF. While this proceeding is convenient and lucid in use, appropriate for many applications and has been widely and successfully used by many groups so far, it should be noted that this separation is not strictly correct [Marquard et al., 2000]. Since BrO and OClO, both species considered here, are only week atmospheric absorbers, the errors caused by the application of the 'traditional' concept are negligible compared to further uncertainties caused by the lack of atmospheric data. In Figure 3 the geometric approximation for the AMF as well as modelled AMFs are displayed.
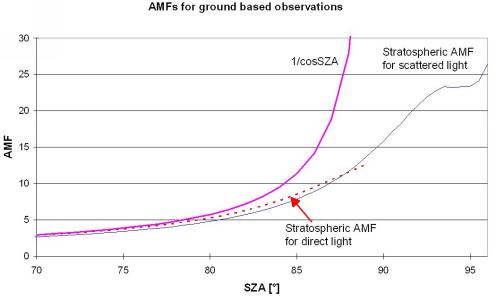
Figure 3 Geometric approximation for the AMF (1/cos[SZA]) compared
to stratospheric AMFs for direct and scattered light for zenith scattered
light observations (The maximum concentration of the assumed trace gas
concentration profile is located at 16 km).
While for BrO often the atmospheric VCD is calculated, OClO data are
usually presented as SCDs for a SZA of 90 or 92 degrees. For specific
applications
(e.g. the comparison with model data) BrO and OClO results are presented
as so called differential slant column densities (DSCD) which is the difference
of the SCD for measurements made at the same day at different SZAs (Usually
at 80 and 90 degree SZA).
7 Specific properties of the DOAS BrO algorithm
The BrO molecule shows a pronounced spectral structure at wavelengths
below 365 nm. For the measurement of scattered light it is difficult to
use the spectral regions below 340 nm because the ozone absorptions are
getting large which affects several approximations only valid for small
absorptions. In particular, also the AMF for BrO shows spectral features
[Marquard et al., 2000] which influence the fitting procedure. It turned
out that for the BrO analysis of zenith sky measurements the wavelength
range between 345 and 359 nm is best suited. This wavelength range is used
for the BrO algorithm described in this section. For some cases, in which
the measured spectrum and the Fraunhofer reference spectrum are measured
within a short period of time (about one week) also a broader spectral
range can be applied (345 - 363 nm). This is in particular the case for
the determination of daily differential SCDs (DSCDs).
7.1 Cross sections
In Table 1 an overview of the reference spectra selected for the BrO algorithm is given. In the selected wavelength range O3 and NO2 are the most dominant absorbers. Thus an Io-correction is applied to the respective cross sections (see section 4). The O4 absorption at 360 shows no spectral fine structure, thus no Io correction was applied. The Ring-spectrum was calculated from the Fraunhofer spectrum according to the approach described in section 5).
For the determination of time series of total columns (SCD or VCD) the
measured spectra for long periods (about one year) are evaluated using
a single Fraunhofer spectrum. The DSCD evaluation is performed with using
daily Fraunhofer reference spectra (SZA = 80°).
| Reference spectrum | temperature | SCD applied for Io correction | Source |
| O3 | 223 K | (1020molec/cm²) | FTS [Voigt et al., 1999a] |
| O3 | 246 K | (1020molec/cm²) | FTS [Voigt et al., 1999a] |
| NO2 | 223 K | (1017molec/cm²) | FTS [Voigt et al., 1999b] |
| OClO | 204 K | no correction | Wahner et al. [1987] |
| BrO | 228 K | no correction | FTS Wilmouth et al. [1999] |
| O4 | 296 K | no correction | Greenblatt et al. [1991] |
| Ring spectrum | 250 K | MFC, Bussemer [1993] | |
| Fraunhofer spectrum | - | for DSCDs:
daily spectra at 80° SZA for SCDs/VCDs:
|
Table 1 Reference spectra used for the BrO analysis.
7.2 Wavelength calibration
The spectral calibration is based on the alignment of the Fraunhofer structures of the measured spectra with those of wavelength calibrated solar intensities from the literature [Kurucz et al., 1984]. This alignment was performed with the software 'WINDOAS' which was developed at the Belgian Institute for Space Aeronomy (BIRA) [M. Van Roozendael, C. Fayt, personal communication]. The high resolved solar spectrum is convoluted and shift and squeeze are allowed. Also included in the fitting process are the reference spectra for O3 (246 K) and NO2 (223K), see Table 1. The literature spectra are fitted to a measured spectrum from April 10, 1997, which is also used as Fraunhofer reference spectrum in the DOAS retrieval.
As a result of this fitting procedure the dispersion and the spectral
resolution of the instrument is determined (see Figures 4 and 5).
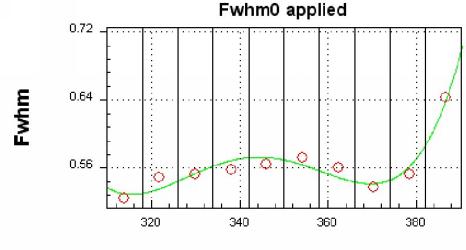 |
| Figure 4. Spectral resolution (FWHM) of the measured spectrum from April 10, 1997. This Fit was performed with the software 'WINDOAS' which was developed at the Belgian Institute for Space Aeronomy (BIRA) [M. Van Roozendael, C. Fayt, personal communication]. |
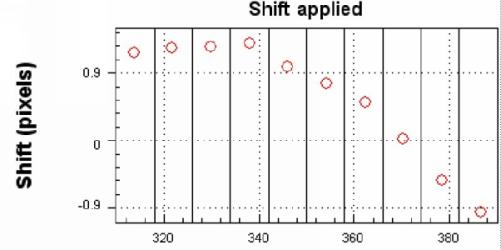 |
| Figure 5. Spectral shift (FWHM) of the measured spectrum from April 10, 1997 compared to the spectral calibration performed by measured atomic emission lines. This Fit was performed with the software 'WINDOAS' which was developed at the Belgian Institute for Space Aeronomy (BIRA) [M. Van Roozendael, C. Fayt, personal communication]. |
The cross sections from the literature (see Table 1) are convoluted using a measured atomic emission line (HG line at 334.15 nm). Since the spectral resolution of the original BrO spectrum (FWHM: 0.4 nm) [Wilmouth et al., 1999] is nearly like that of our own instrument (FWHM: 0.56 nm) it was convoluted with a Gaussian function with a FWHM of only 0.4 nm instead with the measured emission line.
For some applications some additional Fraunhofer have to be used in
the spectral BrO retrieval. This is in particular the case when daily DSCDs
are determined. In these cases the Fraunhofer spectra are shifted in a
fitting procedure to match the spectral calibration of the Fraunhofer spectrum
from April 10, 1997. For the determination of the appropriate shift also
the O3 and NO2 cross sections are included. After
this shift the same set of references spectra (as convoluted for April
10, 1997) is applied.
7.3 Fitting results and uncertainties
After the raw spectra are subtracted for dark current and offset signals they are divided by the spectrum of a halogen lamp to correct the Fabry-Perrot-Etalon effect and the pixel sensitivity of the Diode array. Offset-, dark current- and lamp spectra are recorded every night automatically.
After taking the logarithm the reference spectra (see Table 1) are fitted to the measured spectrum (also a polynomial of degree 3 is included). The spectra are not smoothed. Shift and squeeze of the spectra is allowed, the shift and squeeze parameters of the different reference spectra are linked. More details can also be found at Wagner, [1994], Otten [1997], Otten et al. [1998], Friess [1999].
In Figure 6 the results of a BrO evaluation are presented.
The statistical error is determined by the fitting routine [Stutz and
Platt, 1996]. Typical values are below 10%, see Figure 6. Additional error
sources include uncertainties of the wavelength calibration. However, because
of the high quality of the wavelength calibration of the novel set of cross
sections [Voigt et al., 1999a,b; Wilmouth et al., 1999] these errors are
rather small. Possible errors of the absolute values of the BrO cross section
can cause systematic errors of the retrieved BrO data.
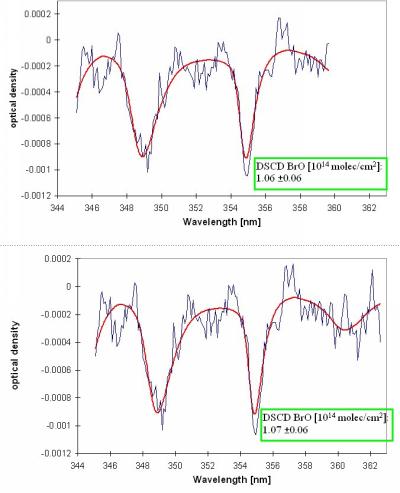
Figure 6 Examples for the BrO evaluation of zenith sky measurement
(February 17,1997,7:57, SZA: 85.4°). The thick lines indicate the BrO
absorption spectra scaled to the respective absorptions retrieved from
the measured spectrum (thin lines).The upper figure shows the standard
wavelength range (345-359 nm), the lower figure an extended range (see
also text).
8 Specific properties of the DOAS OClO algorithm
The OClO molecule shows a pronounced spectral structure at wavelengths
below about 420 nm. It turned out that for the OClO analysis of our zenith
sky measurements the wavelength range between 363 and 391 nm is best suited.
8.1 Cross sections
In Table 2 an overview of the reference spectra selected for the BrO algorithm is given. An Io-correction is applied to the O3 and NO2 cross sections (see section 4). The O4 absorption at 380 shows no spectral fine structure, thus no Io correction was applied. The Ring-spectrum was calculated from the Fraunhofer spectrum according to the approach described in section 5).
For the determination of time series of total columns (SCD or VCD) the
measured spectra for long periods (about weeks to months) are evaluated
using a single Fraunhofer spectrum. The DSCD evaluation is performed with
using daily Fraunhofer reference spectra (SZA = 80°).
| Reference spectrum | temperature | SCD applied for Io correction | Source |
| O3 | 223 K | (1020molec/cm²) | FTS [Voigt et al., 1999a] |
| NO2 | 223 K | (1017molec/cm²) | FTS [Voigt et al., 1999b] |
| OClO | 204 K | no correction | Wahner et al. [1987] |
| O4 | 296 K | no correction | Greenblatt et al. [1991] |
| Ring spectrum | 250 K | MFC, Bussemer [1993] | |
| Fraunhofer spectrum | - | for DSCDs:
daily spectra at 80° SZA for SCDs/VCDs:
|
Table 2 Reference spectra used for the OClO analysis.
8.2 Wavelength calibration
The wavelength calibration was done as described for the BrO evaluation
in section 7.2.
8.3 Fitting results and uncertainties
The details of the OClO data processing are very similar to those of the BrO evaluation and are described in detail in section 7.3.
In Figure 7 the results of an OClO evaluation is presented.
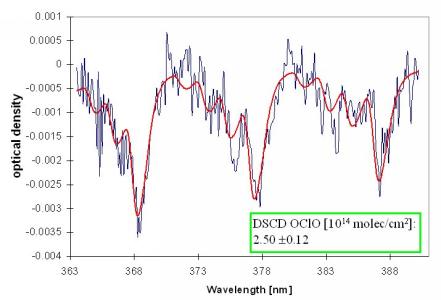
Figure 7 Examples for the OClO evaluation of zenith sky measurement (February 24,1997,15:25, SZA: 90.7°). The thick lines indicate the BrO absorption spectra scaled to the respective absorptions retrieved from the measured spectrum (thin lines).
The statistical error is determined by the fitting routine [Stutz and
Platt, 1996]. Typical values are below 10%, see Figure 7. Additional error
sources include uncertainties of the wavelength calibration. However, because
of the high quality of the wavelength calibration of the novel set of cross
sections [Voigt et al., 1999a,b] these errors are rather small. Possible
errors of the absolute values of the OClO cross section can cause systematic
errors of the retrieved OClO data.
9 References
Fish, D.J., Measurements of stratospheric composition using ultraviolet and visible spectroscopy, PhD thesis, University of Cambridge, 1994.
Friess, U., Spektroskopische Messungen stratosphärischer Spurenstoffe auf der Neumayer-Station (Antarktis) in den Jahren 1994/95, Diploma thesis, University of Heidelberg, 1997.
Friess, U., M.P. Chipperfield, H. Harder, C. Otten, U. Platt, J. Pyle, T. Wagner, and K. Pfeilsticker, Intercomparison of measured and modelled BrO slant column amounts for the Arctic winter and spring 1994/95, Geophys. Res. Lett., 26, 1861-1864, 1999.
Grainger, J.F., and J. Ring, Anomalous Fraunhofer line profiles, Nature, 193, 762, 1962.
Greenblatt G. D., J.J. Orlando, J.B. Burkholder, and A.R. Ravishankara, Absorption measurements of oxygen between 330 and 1140 nm, J. Geophys. Res., 95, 18577-18582, 1990.
Gomer, T., T. Brauers, F. Heintz, J. Stutz, and U. Platt, MFC user manual, version 1.98, inhouse publication, Institut für Umweltphysik, University of Heidelberg, Germany, 1993.
Haug, H., Raman-Streuung von Sonnenlicht in der Atmosphäre, Diploma thesis, University of Heidelberg, Germany, 1996.
Kurucz, R., I. Furenlid, J. Brault, L. Testerman, Solar Flux atlas from 296 to 1300 nm, Tech. Ber., National Solar Observatory, Sunspot, New Mexico, 1984.
Levenberg, K., A method for the solution of certain non-linear problems in least squares, Quart. Appl., Math., 2, 164-168, 1944.
Marquardt, D.W., An algorithm for least-quares estimation of nonlinear parameters, J. Soc. Indust. Math., 11, 431-441, 1963.
Marquard, L.C., T. Wagner, and U. Platt, Improved Air Mass Factor Concepts for Scattered Radiation Differential Optical Absorption Spectroscopy of Atmospheric Species, J. Geophys. Res.,105, 1315-1327, 2000 .
Noxon, J. F., E. C. Whipple, and R. S. Hyde, Stratospheric NO2. 1. Observational method and behaviour at midlatitudes, J. Geophys. Res, 84, 5047-5076, 1979.
Otten, C., Messung stratosphärischer Spurenstoffe in den Wintern 1992/93 bis 1994/95 über Kiruna in Nordschweden, PhD-thesis, University of Heidelberg, 1997.
Otten, C., F. Ferlemann, U. Platt, T. Wagner, and K. Pfeilsticker, Groundbased DOAS UV/visible measurements at Kiruna (Sweden) during the SESAME winters 1993/94 and 1994/95, J. of Atm. Chem., 30, 141-162, 1998.
Perner, D. and U. Platt, Detection of nitrous acid in the atmosphere by differential optical absorption, Geophys. Res. Lett., 7, 1053-1056, 1979.
Platt, U., L. Marquard, T. Wagner, and D. Perner, Corrections for zenith scattered light DOAS, Geophys. Res. Lett., 24, 1759-1762, 1997.Platt, U., et al., BrO in the free troposphere, paper in preparation, 1999.
Richter, A., Absorptionsspektroskopische Messungen stratosphaerischer Spurengase über Bremen, 53°N, PhD Thesis, University of Bremen, 1997.
Solomon, S., A. L. Schmeltekopf, and R. W. Sanders, On the interpretation of zenith sky absorption measurements, J. Geophys. Res, 92, 8311-8319, 1987b.
Stutz J., and U. Platt, Numerical analysis and error estimation of Differential Optical Absorption Spectroscopy measurements least-squares methods, Appl. Optics, 35, 6041-6053, 1996.
Van Roozendael, S.R. Alliwell, P.V. Johnston, A. Richter, M. Van Roozendael, T. Wagner, D.W.Arlander, J.P. Burrows, D.J. Fish, R.L. Jones, K. Karlsen TÆ rnkvist, J.-C. Lambert, K.Pfeilsticker and I.Pundt, Analysis for BrO in zenith-sky spectra - an intercomparison exercise for analysis improvement, to be submitted to JGR, 1999b.
Voigt, S., J. Orphal, and J. P. Burrows, High-Resolution Reference Data by UV-Visible Fourier-Transform Spectroscopy: 1. Absorption Cross-Sections of NO2 in the 250-800 nm Range at Atmospheric Temperatures (223-293 K) and Pressures (100-1000 mbar), Chemical Physics Letters, in preparation, 1999a.
Voigt,S., J. Orphal, and J. P. Burrows: High-Resolution Reference Data by UV-Visible Fourier-Transform Spectroscopy: 2. Absorption Cross-Sections of O3 in the 250-800 nm Range at Atmospheric Temperatures (203-293 K),Chemical Physics Letters, in preparation, 1999b.
Vountas, M., V.V.Rozanov, and J.P. Burrows, Ring Effect: Impact of rotational Raman scattering on radiative transfer in Earth's Atmosphere, Vol. 60, No. 6, 943-961, Journal of Quantitative Spectroscopy and Radiative Transfer, 1998.
Wagner, T., Spektroskopische Messung stratosphärischer Spurenstoffe im arktischen Winter 1993/94: Abweichungen von der normalen Spurenstoffzusamensetzung, Diploma Thesis, University of Heidelberg, 1994.
Wagner, T., Satellite observations of atmospheric halogen oxides, PhD-thesis, University of Heidelberg, Mensch und Buch, Berlin, ISBN 3-89820-032-9, 1999.
Wahner, A., G. Tyndall, and A. Ravishankara, Absorption cross sections for OClO as a function of temperature in the wavelength range from 240-490 nm, J. Phys. Chem., 91, 2735-2738, 1987.
Wahner, A., A.R. Ravishankara, S.P.Sander and R.R.Friedl, Absorption cross-section of BrO between 312 and 385 nm at 298 and 223K, Chem. Phys. Lett., 152, 507-512, 1988.
Wilmouth, D.M., T.F. Hanisco, N.M. Donahue, J.G. Anderson, Fourier transform ultraviolet spectroscopy of the A 2P3/2¬ X 2P3/2 transition of BrO, J. Phys. Chem. A., 103, 8935-8945, 1999.