Measured tracer profiles from the polar stratosphere covering
all seasons 2000
Arvelius, Johan1, H. Nilsson1, S. Kirkwood1, A. Robinson2, N. Harris2 J. Pyle2,
O. Morgenstern3, F. Goutail4 and J.-P. Pommereau4
1 Swedish Institute of Space Physics, P.O. Box 812, S-981 28 Kiruna, Sweden
johan.arvelius@irf.se; Tel: +46 980 79116; Fax: +46 980 79050
2 Dept. of Chemistry, University of Cambridge, UK
3 Max-Planck-Institute for Meteorology, Germany
4 Service d'Aeronomie du CNRS, France
Abstract
DESCARTES is a lightweight balloon-borne grab-sampler instrument for
the long-lived chemical tracer CFC-11 developed at the University of
Cambridge. From Dec 3, 1999 and throughout 2000 it made 15 flights
from Esrange and Andøya. Simultaneous balloon-borne ozone
measurements were made during most flights. The evolution of the
polar airmass over the whole year is studied from these flights and
compared to model profiles at Kiruna and other subsidence studies.
1 Introduction
The polar vortex is heavily investigated during the spring period when
the subsidence and catalytical ozone destruction takes place. This is
especially true for the spring 2000 with the joint SOLVE/THESEO 2000
campaign, e.g. by Greenblatt et al. [2002],Müller et al. [2002] and
Harris et al. [2002]. The DESCARTES instrument [Danis et al., 2000]
participated not only in that campaign but also in the SAMMOA
[Orsolini et al., 2002] and SKERRIES campaigns during the summer and
autumn. By the measurements from this long time-period the evolution
and start of the polar vortex can be studied.
Potential temperature is a height scale that is preserved under
adiabatic displacements. The idea in this study is to use the tracer
mixing ratio as a height scale for the airmass that is preserved even
under diabatic heating and cooling. This approach has recently been
used by Greenblatt et al. [2002] for the spring period vortex. The
tracer abundance and thus the associated height scale will change
during mixing of air masses such as the vortex breakup.
2 Measurements
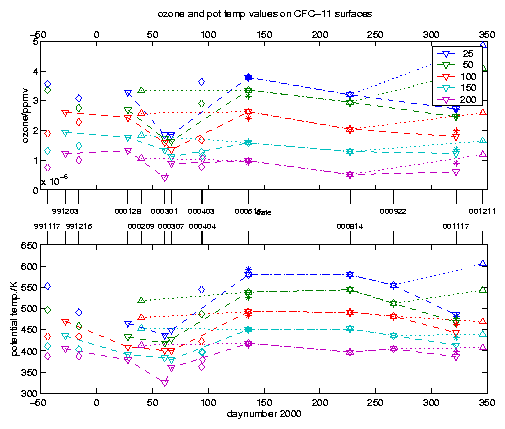
Figure 1 shows the ozone and potential temperature
for all successful flights during the year, interpolated to isopleths
of CFC-11. Interpolation has been done by first integrate the
measurements over the sampling-time of the closest DESCARTES samplings
and then linear interpolation between these points to get
corresponding measurements. All potential temperature values are
calculated from ptu units. For the flights 000128, 000209, 000307 and
000403 ozone are derived from SAOZ [Pommereau and Piquard, 1994]
measurements, and for the rest from ozone sondes.
Figure 1: Ozone and potential temperature measurements interpolated to CFC levels from DESCARTES measurements. Downward facing triangles are in-vortex flights, upward facing are out of vortex flights, diamonds are vortex edge and stars are for double flights interpolations to the second DESCARTES profile and otherwise vortex edge. Flights in summer (May to October) are plotted with both the in and out of vortex series.
Vortex classifications are made by an upper and a lower PV threshold
where over the upper means in-vortex, in between means on the edge and
under the lower means out-of-vortex. These thresholds increases from
30 to 42 pvu at 475 K from first of November to new year for the upper
and from 20 to 25 pvu for the lower. PV data are taken from the ECMWF
analysis.
A special slimcat run has been performed during the winter/spring of
1999/2000 including several additional tracers, among which are CFC-11
and N2O. This run is driven by UKMO analysis.
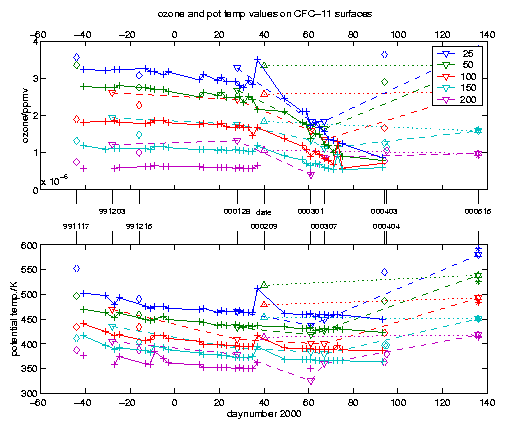
Figure 2 shows a comparison between samplings of the
model run over Kiruna (67.89N/22.08E) every second day during the run
and the DESCARTES measurements. The model samplings are classified to
be in or out of vortex according to the same criterion as the flights.
Figure 2: Detail of figure 1 for the springtime plotted together with a SLIMCAT simulation interpolated to KIRUNA. Plus-marks is the model in-vortex days.
3 Conclusions
According to figure 1 the polar air is undergoing a diabatic cooling in September even before a clear vortex has formed at the order of tenth of Kelvin at 25 pptv CFC-11.
Compared to Greenblatt et al. [2002] which is a similar
investigation with the same model but averaged over the whole polar
vortex (70-80° equivalent PV-latitude) the trend in this local
series over Kiruna show slightly less diabatic cooling of the vortex.
This is qualitatively in agreement with our measurements but as
Greenblatt uses N2O which is not measured by DESCARTES
a direct comparison is not possible. Our few flights is also a very
small statistical set for quantitative analyses.
Remarkable in the Greenblatt study is the simulated warming in higher
altitudes that appears after day 70 but is not seen in their
observational data and not in our local sampling of the model.
Unfortunately there are not many model samplings over Kiruna in this
time period which are in the vortex. The remaining difference compared
to Greenblatt might be due to differences in the UKMO and ECMWF
analysis. The flight 000403 is unfortunately in the vortex edge
region. The flight data shows high potential temperature on CFC-11
isopleths compared to previous vortex measurements. The PV for this
flight is very close to the upper threshold limit and could thus
possibly support the model result discussed in
Greenblatt et al. [2002]. However a proper back trajectory
calculation of the sampled volumes must be performed in order to reach
any substantial conclusion on this matter.
References
- [Danis et al. 2000]
-
F. Danis, N.R.P. Harris, W.H. Taylor, J.D. McIntyre, P.G. Simmonds, and J.A.
Pyle.
DESCARTES: A novel lightweight balloon-borne instrument for
measurement of Halocarbons.
Review of Scientific Instruments, 71 (1):
271-280, 2000.
- [Greenblatt et al. 2002]
-
Jeffery B. Greenblatt, Hans-Jürg Jost, Max Loewenstein, James R. Podolske,
Dale F. Hurst, James W. Elkins, Sue M. Schauffler, Elliot L. Atlas, Robert L.
Herman, Christopher R. Webster, T. Paul Bui, Fred L. Moore, Eric A. Ray,
Samuel Oltmans, Holger Vömel, Jean-François Blavier, Bhaswar Sen,
Robert A. Stachnik, Geoffrey C. Toon, Andreas Engel, Melanie Müller,
Ulrich Schmidt, Holger Bremer adn R. Bradley Pierce, Björn-Martin
Sinnhuber, Martyn Chipperfield, and Franck Lefèvre.
Tracer-based determination of vortex descent in the 1999-2000 arctic
winter.
J. Geophys. Res., accepted, 2002.
- [Harris et al. 2002]
-
N. R. P. Harris, M. Rex, F. Goutail, B. M. Knudsen, G. L. Manney,
R. Müller, and P. von der Gathen.
Comparison of empirically derived ozone losses in the arctic vortex.
J. Geophys. Res., accepted, 2002.
- [Müller et al. 2002]
-
Rolf Müller, Simone Tilmes, Jens-Uwe Groß Daniel S. McKenna, Melanie
Müller, Ulrich Schmidt, Geoffrey C. Toon, Robert A. Stachnik, James J.
Margitan, James W. Elkins, Johan Arvelius, and James M. Russel III.
Chlorine activation and chemical ozone loss deduced from HALOE and
balloon measurments in the arctic during the winter of 1999-2000.
J. Geophys. Res., accepted, 2002.
- [Orsolini et al. 2002]
-
Y. Orsolini et al.
Final report, Spring-to-Autumn Measurements and Modelling of
Ozone and Active species, July 2002.
- [Pommereau and Piquard 1994]
-
J. P Pommereau and J. Piquard.
Ozone, nitrogen dioxide and aerosol vertical distributions by
uv-visible solar occultation from balloons.
Geophys. Res. Lett., 13: 1227-1230, 1994.
File translated from
TEX
by
TTH,
version 3.08.
On 10 Oct 2002, 17:14.